Archive
VMware View Usage Dashboard
I’ve had the new version of my app running for a few months. This has given me quite a bit of raw data, but no really nice method for perusing it (aside from just raw SQL on the DB).
So I took some time yesterday to write a sort of dashboard based on the data I’ve collected and based on questions I get from the “higher-ups.”
This is version number 1. The dashboard is web-based using a combination of whatever I felt like writing at the time, some .NET, some classic ASP, javascript and AJAX. All of the graphs/charts on the page are from Google charts.
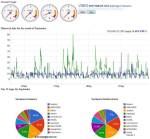
The top of the page shows current usage in each of my three pools. The gauge is scaled for the number of machines in the pool: pool 1 has 20 machines, pools 2 and 3 each have 100. The CPU utilization is averaged across all users as the percent reported by Windows itself (like you would see in Task Manager).
Next to those is a term cloud that shows the top 10 currently running apps in the pools. As a cloud it means that the more instances there are of a given app, the larger the font in respect to the other apps listed.
The Start and Stop buttons control the AJAX that refreshes the gauges and term cloud on a specific interval.
Under that is a graph that shows logins and average CPU for the month of September. This one is just looking at one specific pool right now (Pool 2 from the gauges). And below that are two pie charts that show top apps for the month by frequency and time-in-use.
I think I will continue to tweak this based on what I’d like to see along with any other requests I get from ‘higher up.’
Desktop Usage Stats
I’ve completely re-written my application to gather more data on usage. Now I have access to real-time data on which apps users are running along with CPU utilization. Kind of interesting to see the numbers emerging from the data.
As an example, top apps are Internet Explorer, Word, Firefox then trailing quite a bit behind Excel (Access was 6th, Visual Studio was 9th). One of the surprising things that came up is idle time. Seeing scrnsave.scr show up in the list of applications started me looking at how often the machines are sitting ‘idle’ as evidenced by scrnsave.scr showing up in the application list. A quick bit of ts-sql showed that for about 11% of the logged-in time, scrnsave.scr was active. I need to let the new version run a bit longer to get a better idea what the average CPU utilization is.
